With so much noise in the media, we thought you'd want to see the actual numbers for the Denver Metro area in the month of October. Land Title was kind enough to share this information with us so we thought we'd share this information with you. If you have any questions or want to chat about any of this, please call us: you know we love talking to you about this far more than we love nerding out on these numbers with one another!
Single Family Average$743,131 |
Up 9.5% YoY |
Condo/Townhome Average$476,665 |
Up 9.0% YoY |
October HighlightsBoth seasonality and increasing interest rates played a role in the Greater Metro Denver housing market in October. Buyers continued to have an upper hand - when compared to the prior two years - with more days on market and a decreased percent closed price to list price, as well as more inventory. In fact, months supply of listings was up 88.9% when compared to last year at this time.
The first graph below showcases the history of pending sales for October since 2009. What is most notable is that typically we continue to see active inventory grow year-over-year due to the increase of new listings. But, what is different for October 2022 is that new listings were down considerably, but active listings are still high due to the decrease in demand. |
 |
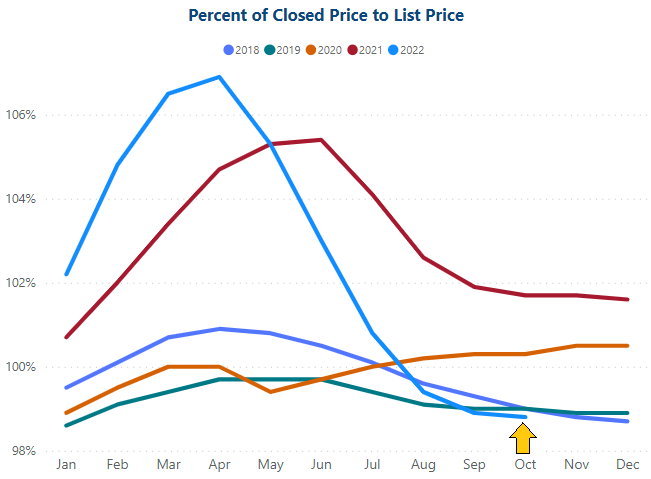
Percent of Closed Price to List PriceThis data point saw a continued drop and was down 0.1% when compared to last month. This data point is the lowest we have seen in 4 years. |
98.8%Closed to List Price |
2.9% YoY |
 |
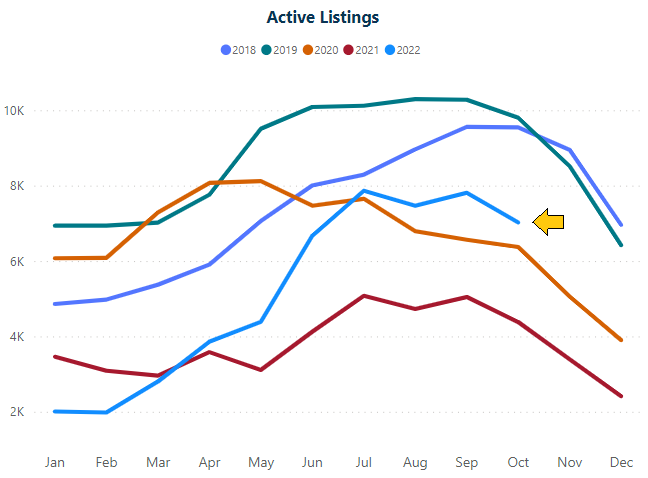
Supply - Active ListingsActive inventory was up 60.2% year-over-year and down 10.1% compared to last month. |
7,022Active Listings |
60.2% YoY |
 |
New ListingsNew listings were down 28.1% when compared to last year and down 26.6% when compared to last month. This data point is the lowest we have seen in 4 years and is likely due to a "wait and see" approach by sellers. |
3,646New Listings |
28.1% YoY |
 |
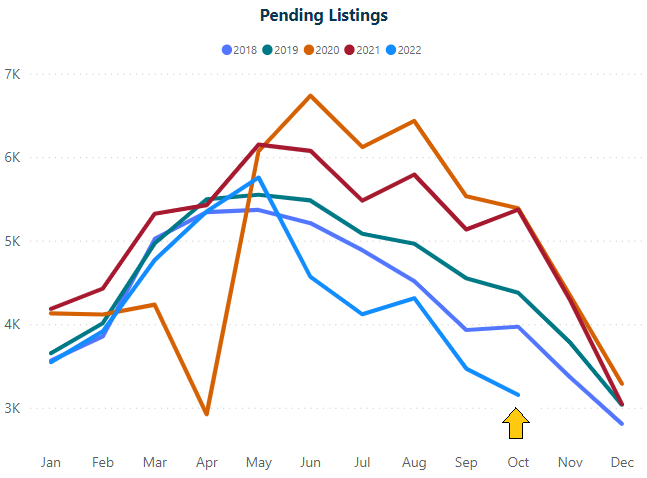
Demand - Pending SalesDemand is down 41.3% year-over-year and down 9.1% when compared to last month. |
3,153Pending Sales |
41.3% YoY |
 |
Average Price per SqFt Single-FamilyThe average price per square foot for single family homes is equal to last month, and is up 4.5% when compared to last year at this time. |
$279Avg PPSFSingle Family |
4.5% YoY |
 |
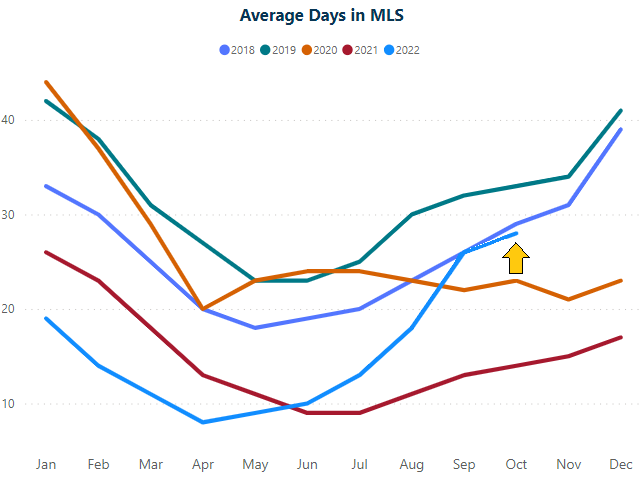
Average Days in MLSDays on market saw a dramatic increase to 28 days on average and is roughly equal to what we saw in 2018. This was an increase of 7.7% when compared to last month, which was at 26 days on average. |
28Days in MLS |
100.0% YoY |
 |
Greater Metro Denver includes the following counties:
|
Thank you, Laura Fick and Lisa Sparr at Land Title, for sharing this information with us and allowing us to share this with all of you.


